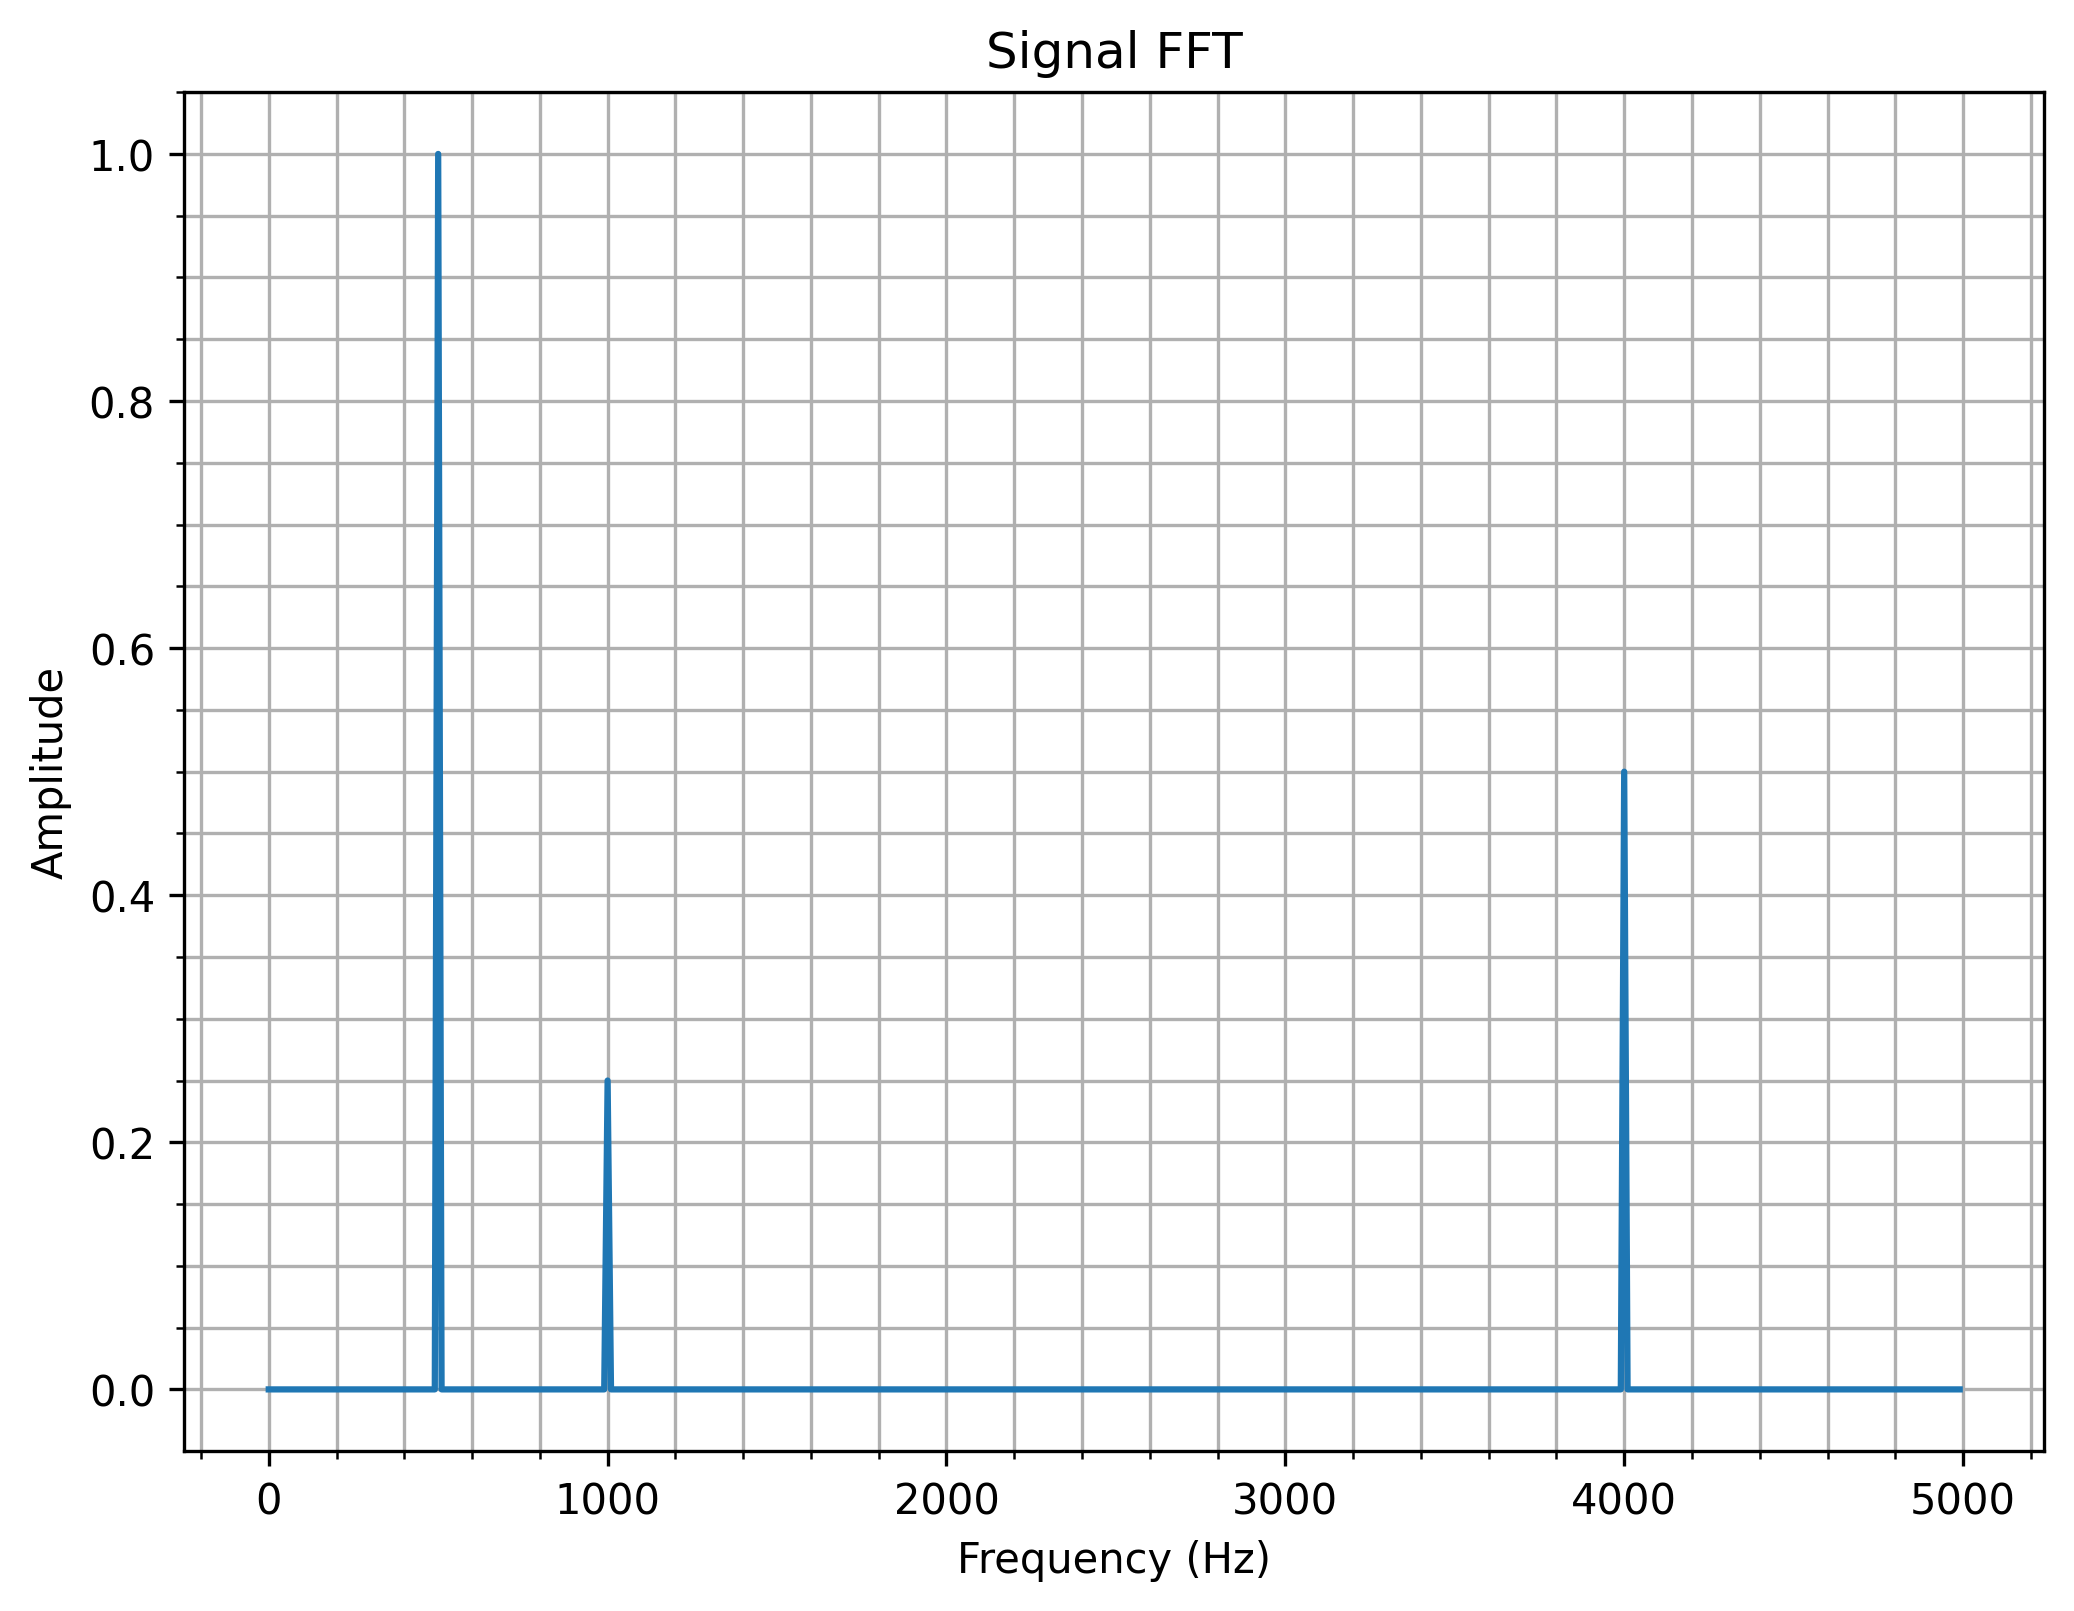
In the following Python script it is shown how the aliasing effect (having signals whose frequency is beyond half of the sampling frequency, i.e., \(\frac{f_s}{2}\)) can be intuitively understood as a folding of the frequencies outside the \(\left[0, \frac{f_s}{2}\right]\) range.
In the script, the sampling frequency is 10 kHz. Then, 3 sinusoids of frequency \(f_{s1} = 500~Hz\), \(f_{s2} = 6~kHz\) and \(f_{s3} = 11~kHz\) are generated. The FFT of the sum of s1, s2 and s3 is computed and plotted. Given that the Nyquist frequency in the system is 5 kHz, it can be seen on the FFT plot how the frequencies wrap around \(\frac{f_s}{2}\) and 0.
Just as a reminder, the way the X-axis on the FFT is explained in FFT resolution.
import numpy as np
import numpy.fft as fft
import matplotlib.pyplot as plt

# Define sampling frequency
fs = 10e3
Ts = 1/fs

# Define time array
n_periods = 1000
total_time = 1/fs * n_periods
t = np.arange(0, total_time, Ts)


# %% Define signal 1
f1 = 500
s1 = np.sin(2*np.pi*f1*t)


# %% Define signal 2
# Since fs = 5_000, f2 will fold to 4_000 Hz bin
f2 = 6_000
s2 = 0.5 * np.sin(2*np.pi*f2*t)

# %% Define signal 3
# Since fs = 5_000, f3 will fold first on 5_000 Hz and then on 0 again. Therefore, f3 will be shown at 1_000 Hz bin
f3 = 11_000
s3 = 0.25 * np.sin(2*np.pi*f3*t)

# %% Define signal as a sum of s1, s2 and s3
s = s1 + s2 + s3

# %% Compute FFT
# Total number of samples
N_samples = len(s)
print(f"Number of samples: {N_samples}")
# Floor in case division is not integer
half_N_samples = int(np.floor(N_samples/2))
# Define frequency bin width
delta_f = fs/N_samples

# Compute frequency bins until Nyquist frequency
freq_bins = np.arange(0, fs/2, delta_f)

Y = fft.fft(s)

plt.figure(figsize=(8,6), dpi=300)

# Plot only half of the FFT result. Plot absolute value and scale it to represent amplitude
plt.plot(freq_bins, 2.0 / N_samples * np.abs(Y)[:half_N_samples])
plt.grid(True, which='both')
plt.minorticks_on()
plt.title('Signal FFT')
plt.xlabel('Frequency (Hz)')
plt.ylabel('Amplitude')
plt.show()